- UID
- 106192
- 热情
- 247
- 人气
- 2400
- 主题
- 19
- 帖子
- 311
- 精华
- 0
- 积分
- 1520
- 分享
- 0
- 记录
- 0
- 相册
- 0
- 好友
- 0
- 日志
- 0
- 在线时间
- 3119 小时
- 注册时间
- 2007-2-2
- 阅读权限
- 20
- 最后登录
- 2021-8-6
 
升级    52% 52% - UID
- 106192
- 热情
- 247
- 人气
- 2400
- 主题
- 19
- 帖子
- 311
- 精华
- 0
- 积分
- 1520
- 阅读权限
- 20
- 注册时间
- 2007-2-2
|
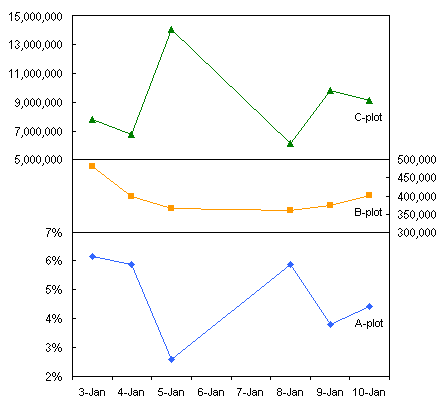
maybe read your chart incorrectly but it seems you are asking for 4 axes -- two different scales of absolute values (top 2 lines), one % scale and one Time/Date axis. which is impossible in a line chart. the maximum axis you can have are 3 -- one first Y-axis, one Secondary Y-axis and one X-axis. strictly it is still 2 axes, Y and X while the Y has two scales.
bubble chart can do 3D but for a trend. for your case, I can only think of one Log scale in Y-axis to accommodate for both two different scales, then a secondary Y-axis for %, and Date for X-axis |
|


 发表于 2010-12-10 10:22:26
 分享
分享 收藏
收藏


