标题: Help!- Excel with 3 Axes [打印本页] 作者: InMyDream 时间: 2010-12-10 10:22:26 标题: Help!- Excel with 3 Axes
Anyone knows how to have 3 Axis in one chart?
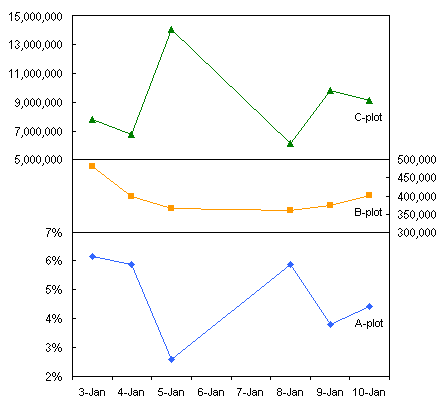
Basically i need to tell unit & dollars as axis on each side of the chart, also i need to have percentage at the bottom of the chart as well.
Thanks,
Hope you can see example chart attached here:
作者: AUTUMN2010 时间: 2010-12-10 11:00:47
本帖最后由 AUTUMN2010 于 2010-12-10 12:05 编辑
IT'S EASY IF Y SHAFT HAVE SAME SCALE .作者: love_3_month 时间: 2010-12-10 11:24:50
i wonder how to achieve that............. i can only have 2 axes作者: InMyDream 时间: 2010-12-10 12:28:53
i wonder how to achieve that............. i can only have 2 axes
love_3_month 发表于 2010-12-10 12:24
me too!..........................作者: homealone 时间: 2010-12-10 12:45:02
maybe read your chart incorrectly but it seems you are asking for 4 axes -- two different scales of absolute values (top 2 lines), one % scale and one Time/Date axis. which is impossible in a line chart. the maximum axis you can have are 3 -- one first Y-axis, one Secondary Y-axis and one X-axis. strictly it is still 2 axes, Y and X while the Y has two scales.
bubble chart can do 3D but for a trend. for your case, I can only think of one Log scale in Y-axis to accommodate for both two different scales, then a secondary Y-axis for %, and Date for X-axis